Getting started
This Section aims at helping users to get started with the SeDuCe testbed. Section I covers how to create an account. Section II covers the basic features of the SeDuCe testbed. Section III introduces the API and its documentation. Finally, in Section IV we provides a link to a github repository containing examples that will help users to get started with the API of the SeDuCe platform. These examples illustrate how to fetch the temperature and the power consumption from a server in SeDuCe. We advise users to take a look before experimenting!
I- Account creation
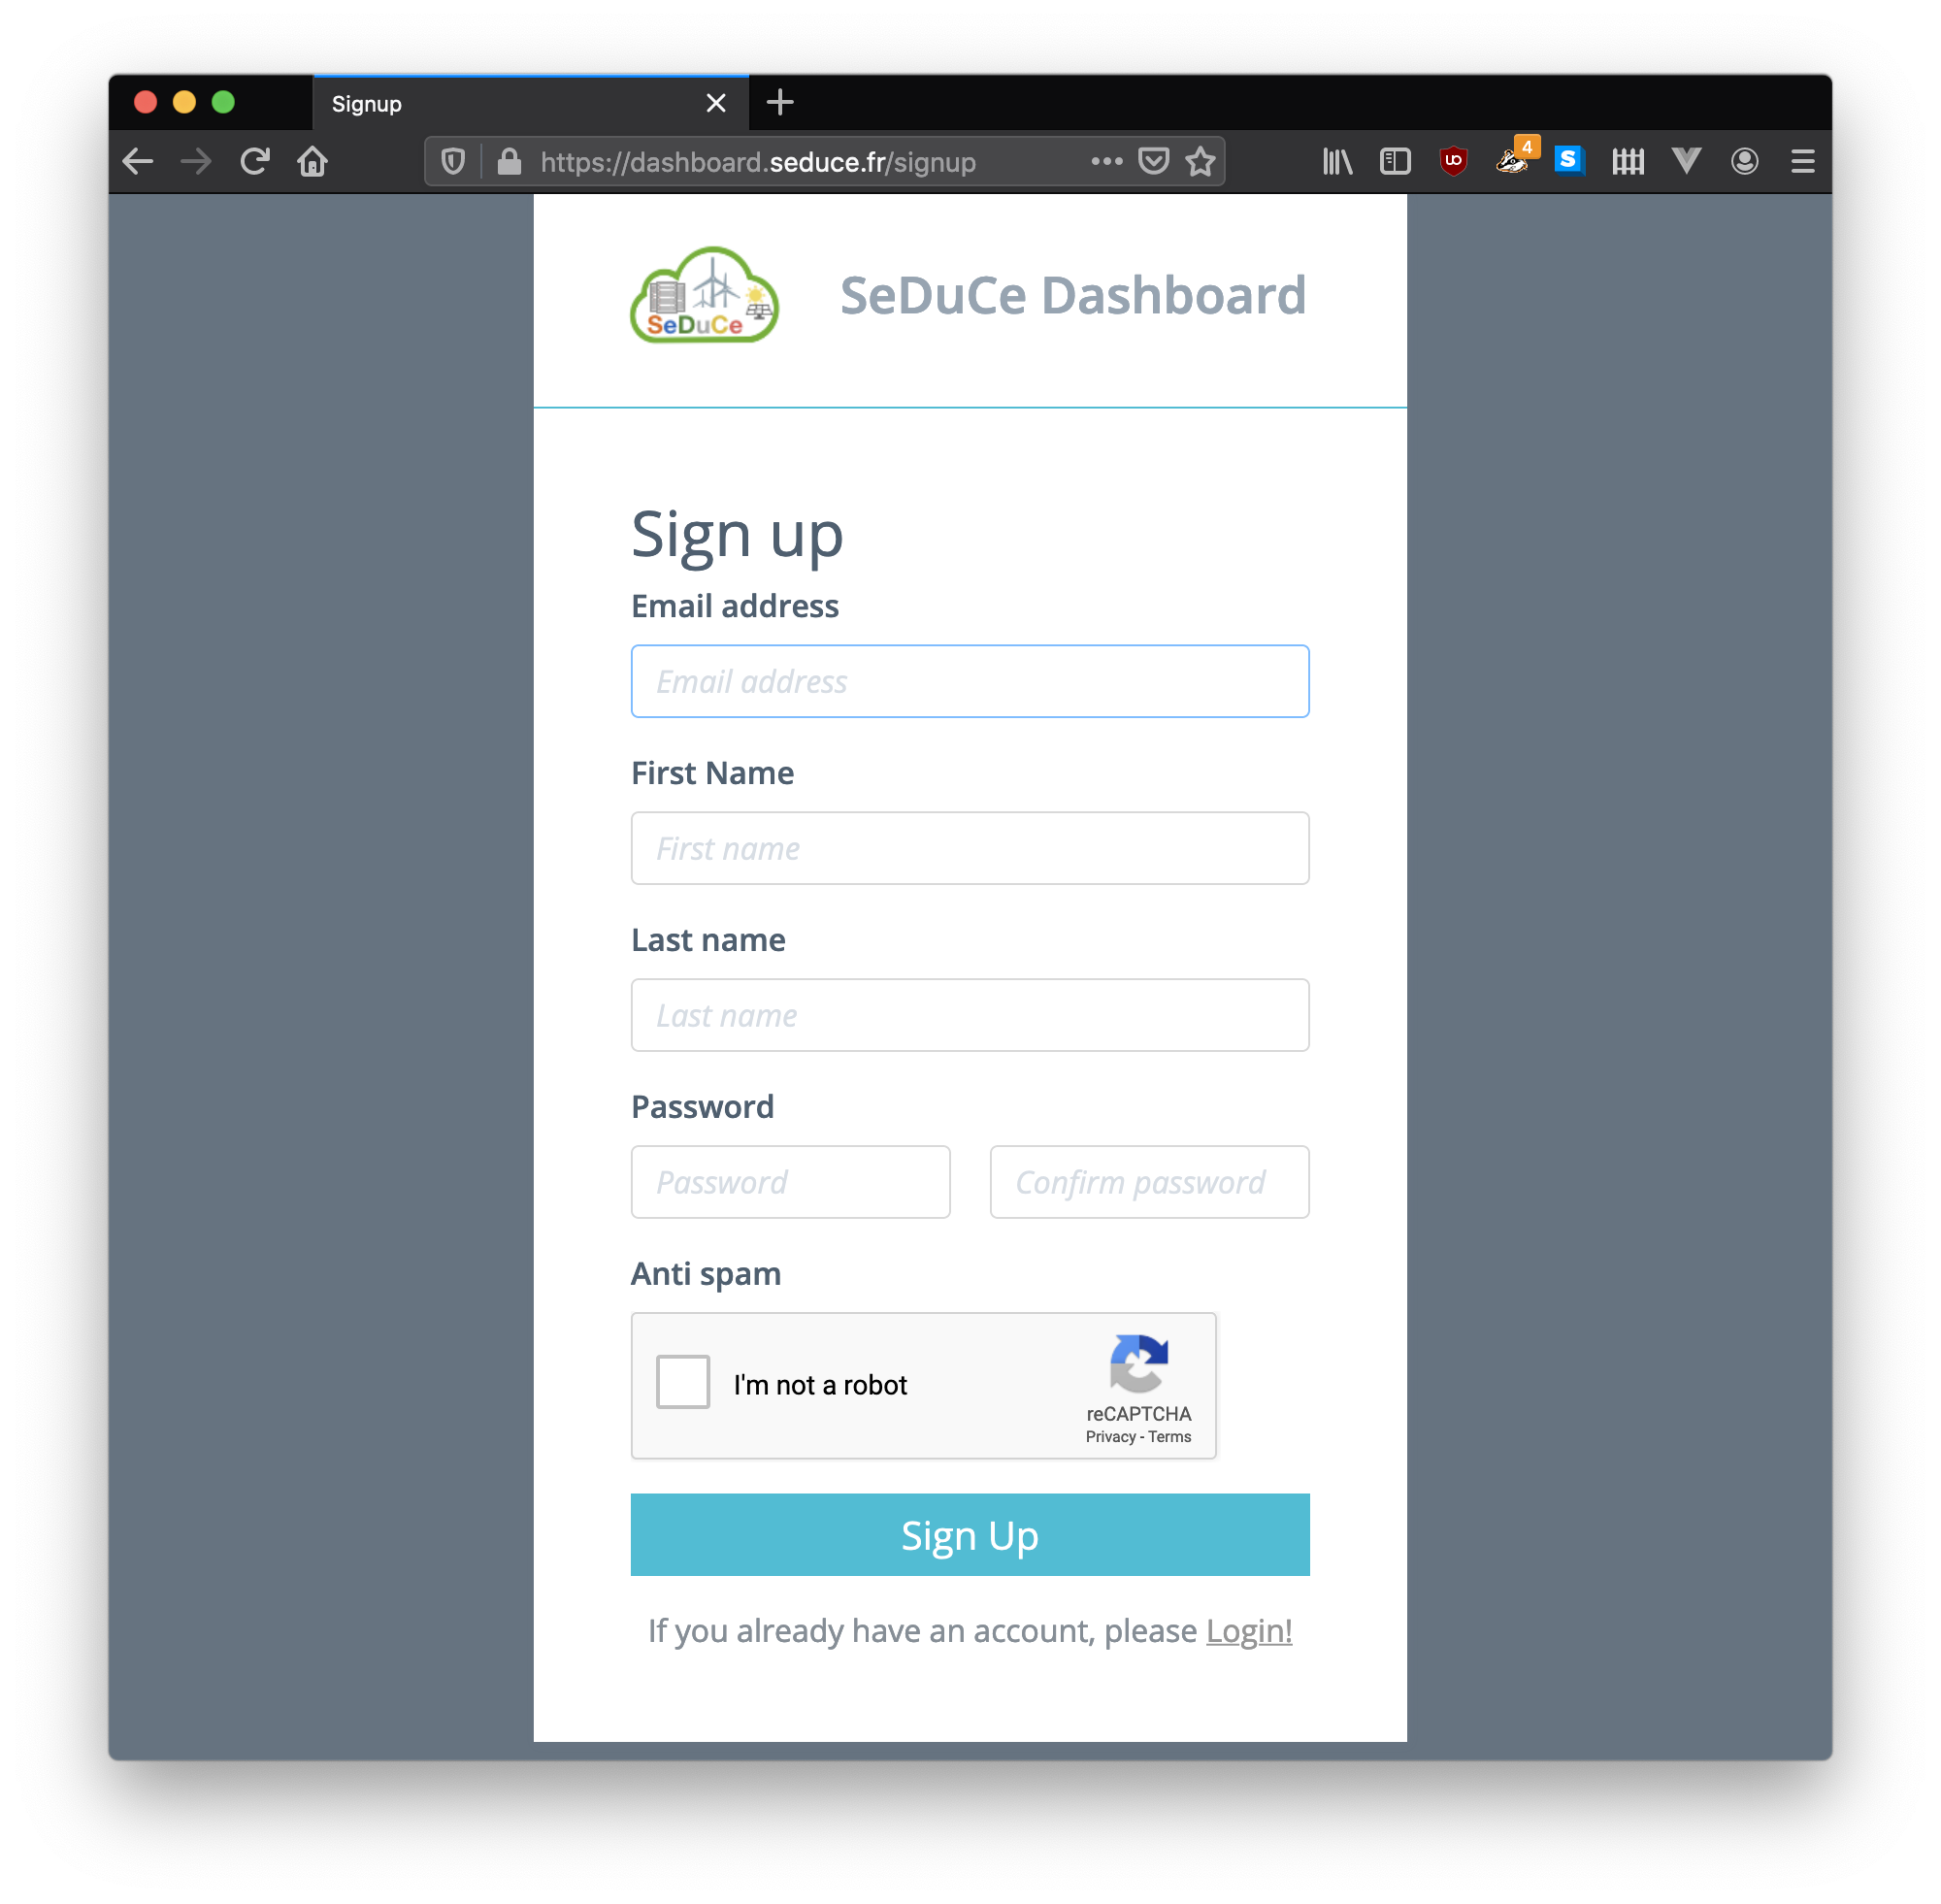
To create an account, go to https://dashboard.seduce.fr and click on Sign Up. You should land on the following page:
Once the form is submited, you should quickly receive an email that will ask to confirm your email address, as in the following snippet:
Hello [User's name],

Thanks for creating an account on the Seduce system.

In order to proceed with your account creation, please confirm your email by browsing on the following link:
https://dashboard.seduce.fr/confirm_email/token/[confirmation_token]

Best Regards,
Seduce administrators
Once your email is validated, an administrator of the SeDuCe testbed will examine your account request. Once the request is validated, you should receive an other email that will confirm the creation.
At this moment, you should be able to access the SeDuCe dashboard, by using your credentials on https://dashboard.seduce.fr/login.
II- Basic features of the SeDuCe dashboard
Once your account has been activated and validated, you can access the dashboard at https://dashboard.seduce.fr/
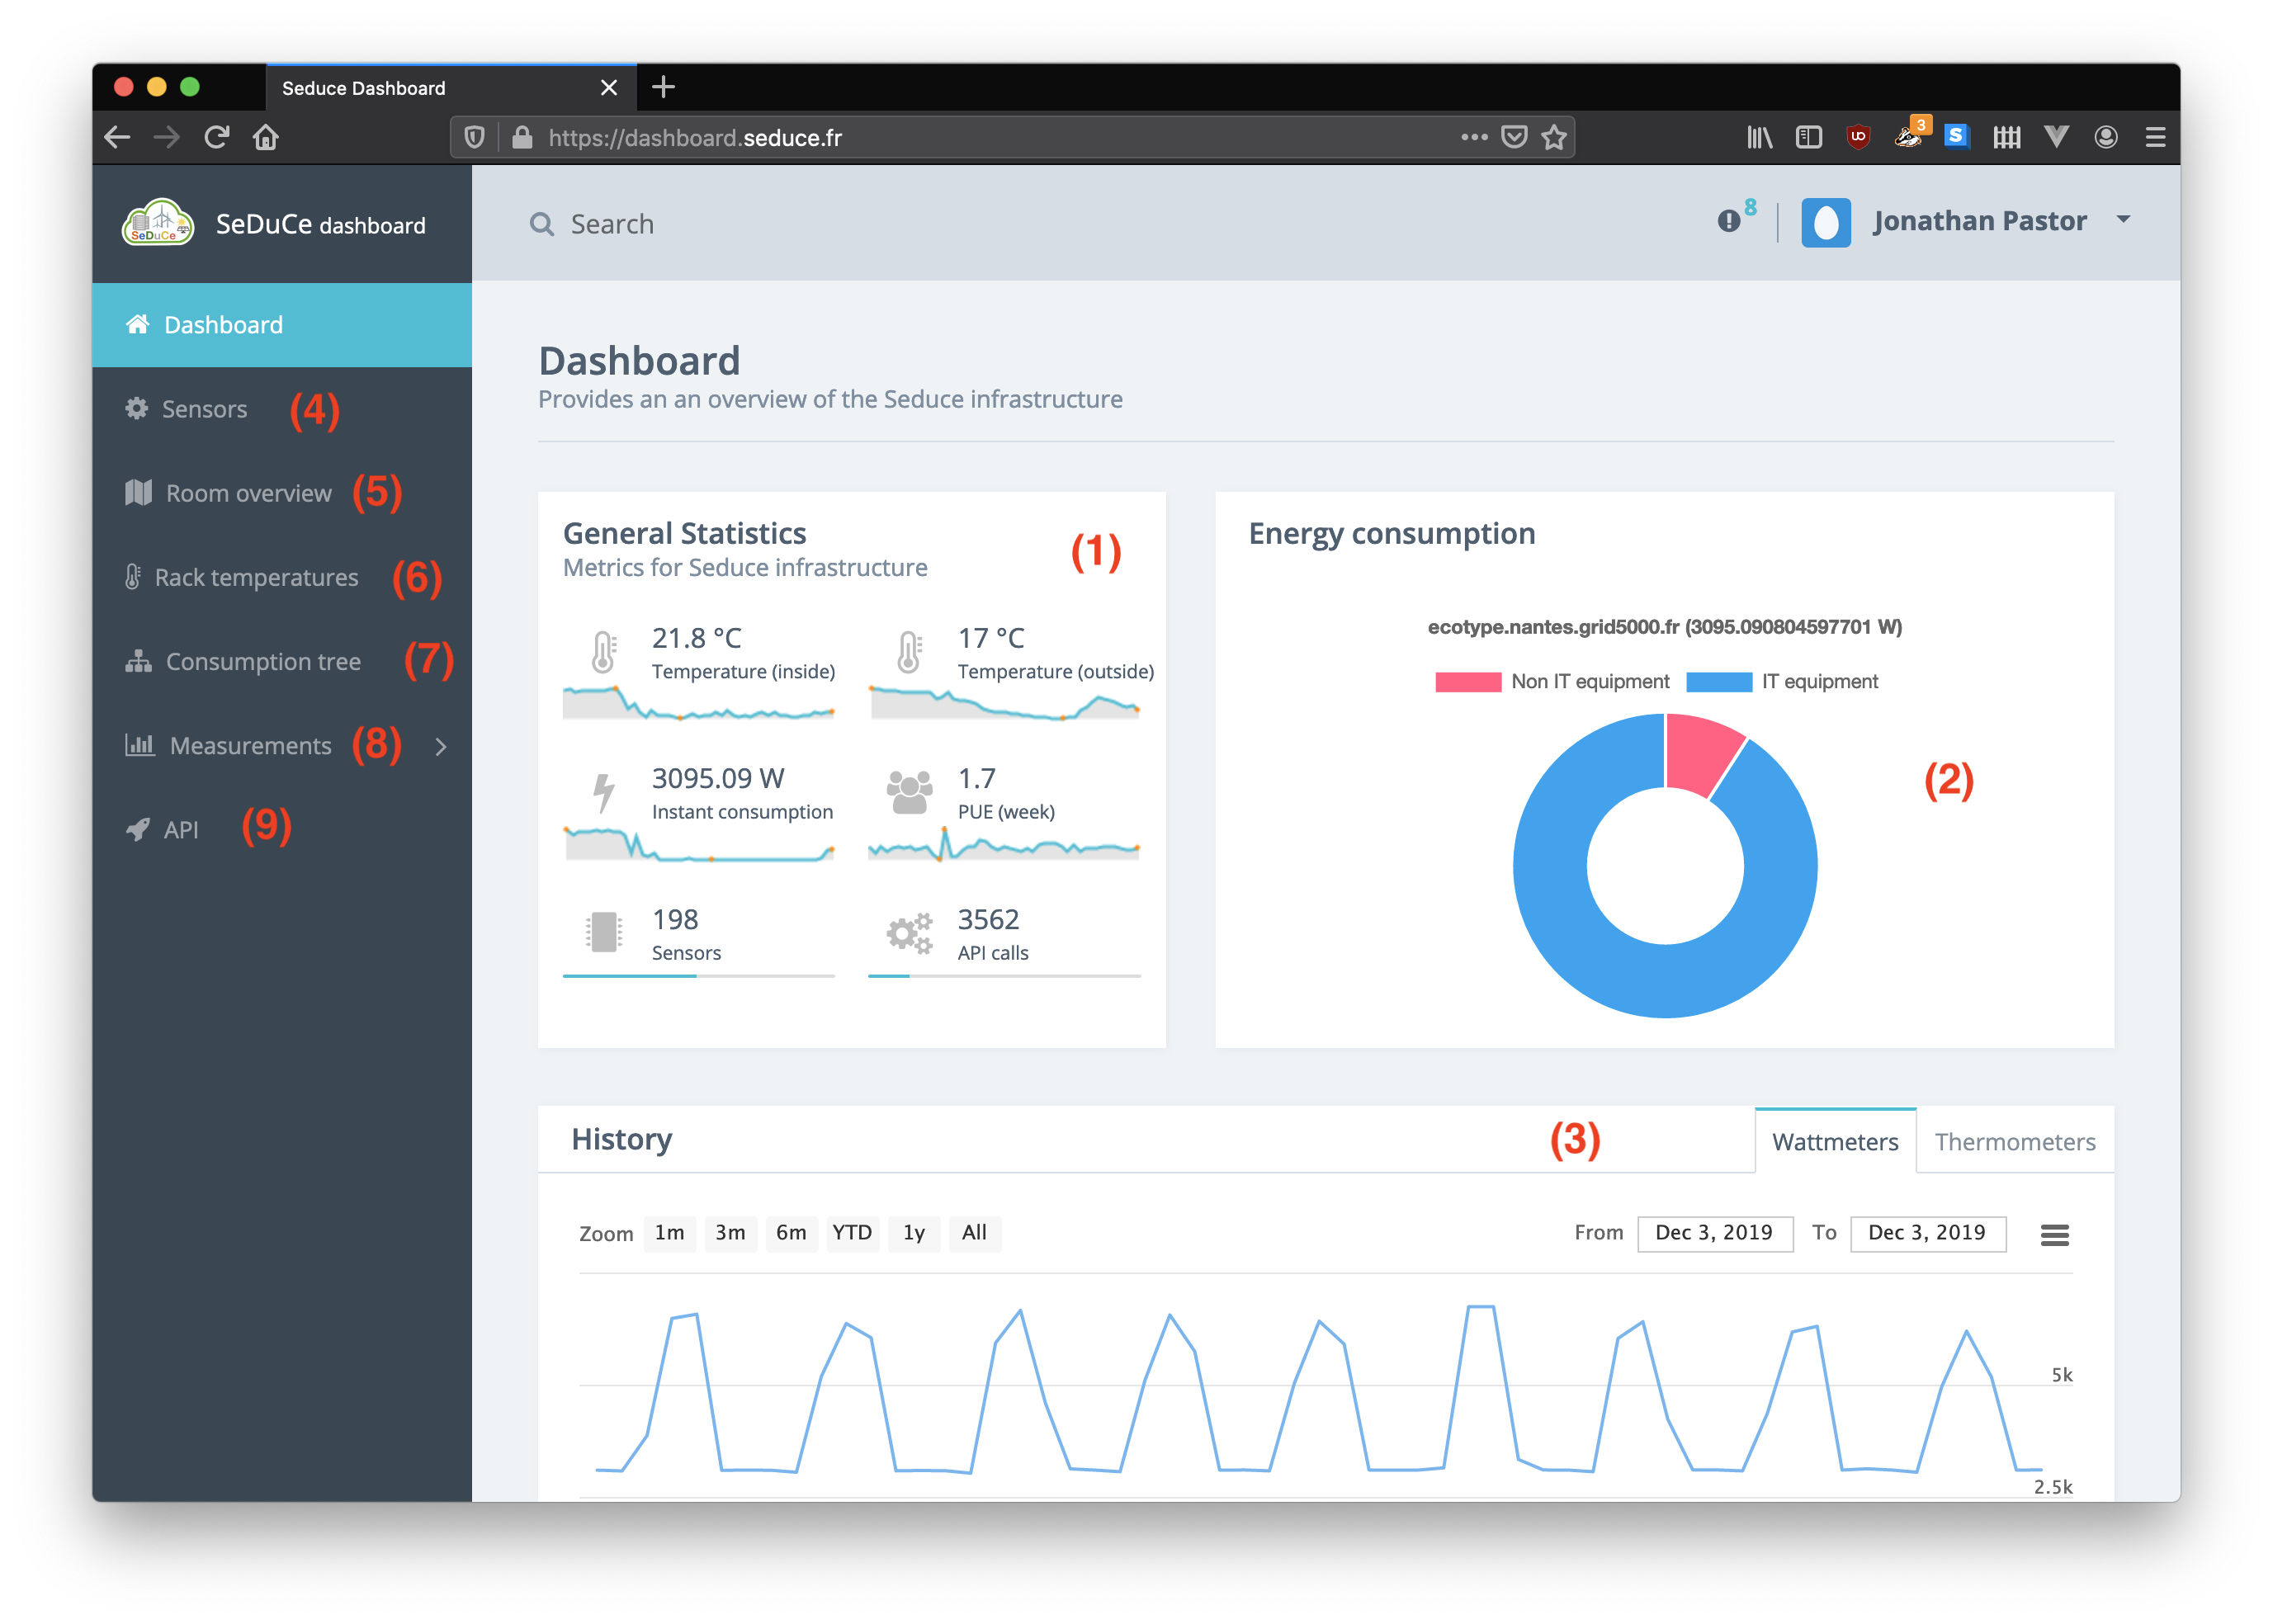
On the previous screenshot, you can access
- Quick metrics about the SeDuCe testbed
- Instantaneous repartition of the power consumption between IT (servers + network) equipments and the support equipments (cooling systems)
- History of the power consumption and the average temperature of the SeDuCe tesbed (aggregated by minutes)
- View the listing of all sensors of SeDuCe
- Get an overview of where the sensors are located in the server room
- Get a visual on the front and back temperatures of the servers of SeDuCe
- Get an hierarchic view on how the power consumption is distributed in SeDuCe
- Visualize and compare the power consumptions and temperatures of several servers at the same time
- Access the web documentation of the SeDuCe API
III- Interacting with the API
Data collected by the SeDuCe platform is exposed via a simple API located at https://api.seduce.fr.
Each entry point of the API is documented on https://api.seduce.fr/apidocs
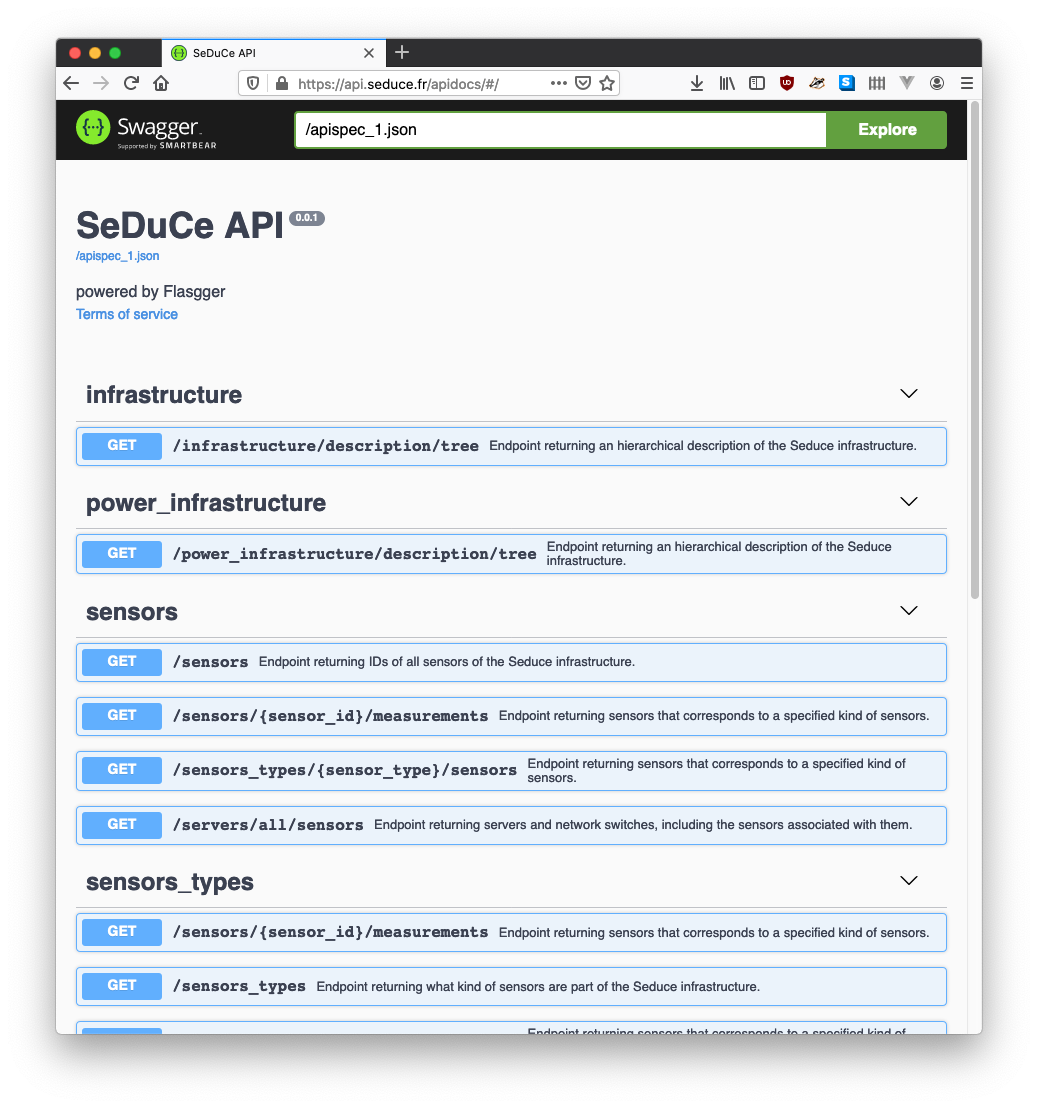
To view details on an endpoint, click on the corresponding endpoint, to view:
- The URL that should be used to access the API endpoint (and the corresponding curl command!)
- Structure of the response
- HTTP error codes
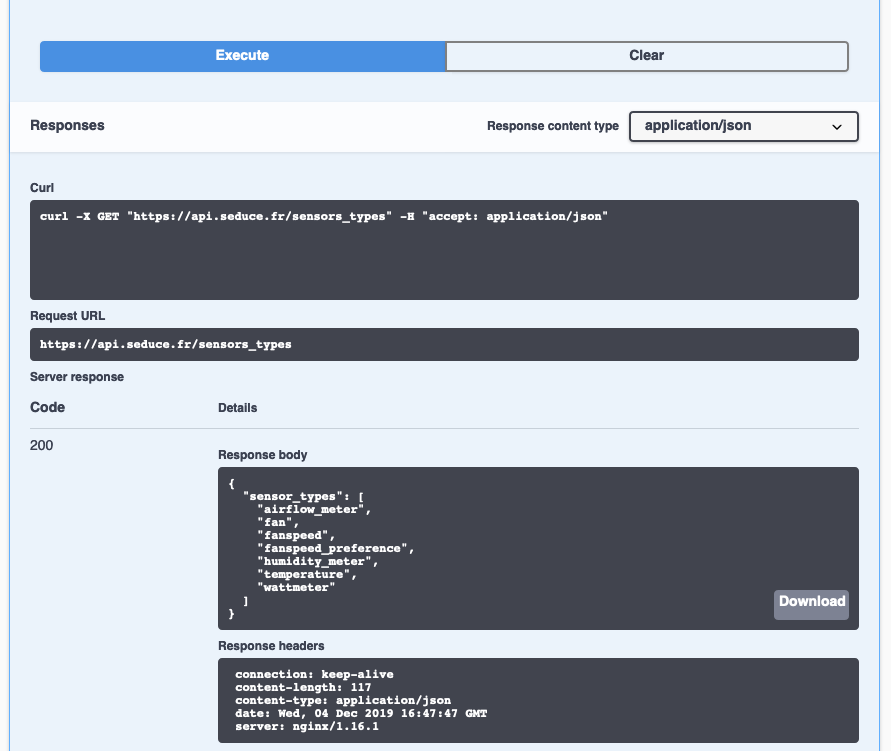
Please note that you can try directly the API endpoints from your browser, as follow:
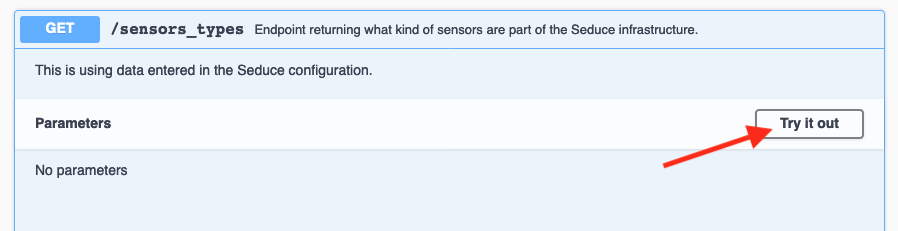
The response (payload + HTTP response code) will be displayed in the browser
IV- Example scripts to get started with the API
To help users to get started with interacting the API, we have created a github repository containing example scripts written in Python3. These scripts are available at https://github.com/SeduceProject/examples.