Architecture
We have builded the ecotype cluster, which contains 48 servers, and is integrated in the Grid’5000 infrastructure: any Grid’5000 user can reserve servers of the ecotype cluster and conduct experiments on them by using the usual Grid’5000 tools. The testbed is designed for research related to power and thermal management in datacenters: during an experiment, a user can access in real time to information regarding the temperature of the servers involved in its experiment, and get the power consumption of any parts of the testbed (servers, switches, cooling systems, etc.), or control some parameters of the testbed, such as setting temperature targets for the cooling systems of the cluster.
Servers of the ecotype cluster are based on DELL PowerEdge R630 and contains a pair of Intel Xeon E5-2630L v4 CPUs (10 cores, 20 threads per CPU), 128GB of RAM, and 400GB Solid State Disk (SSD). The CPUs have been designed to have a lower power consumption than other CPUs of the XEON 26XX serie, with a Thermal Design Power (TDP) of 55W. Each server is connected via two 10GBe links to the Grid’5000 production network, and via a single 1GBe link to the Grid’5000 management network. For instance, the Grid’5000 production network is used for transferring the disk images required to deploy an experiment or to support communications between experimental components, while the management network is mainly used by the Grid’5000 backend to communicate with management cards of servers to turn them on and off. Additionally, each server is certified to work in hot environments where temperature can be up to 35°C. These hardware specifications will enable users to perform experiments at different levels of temperature.
The cluster is composed of 5 air-tights racks (Z1, Z2, Z3, Z4, Z5) based on the Schneider Electric IN-ROW model. These air-tights racks are equipped with Plexiglas doors, and create a separation between the air inside the racks and the air from outside the racks.
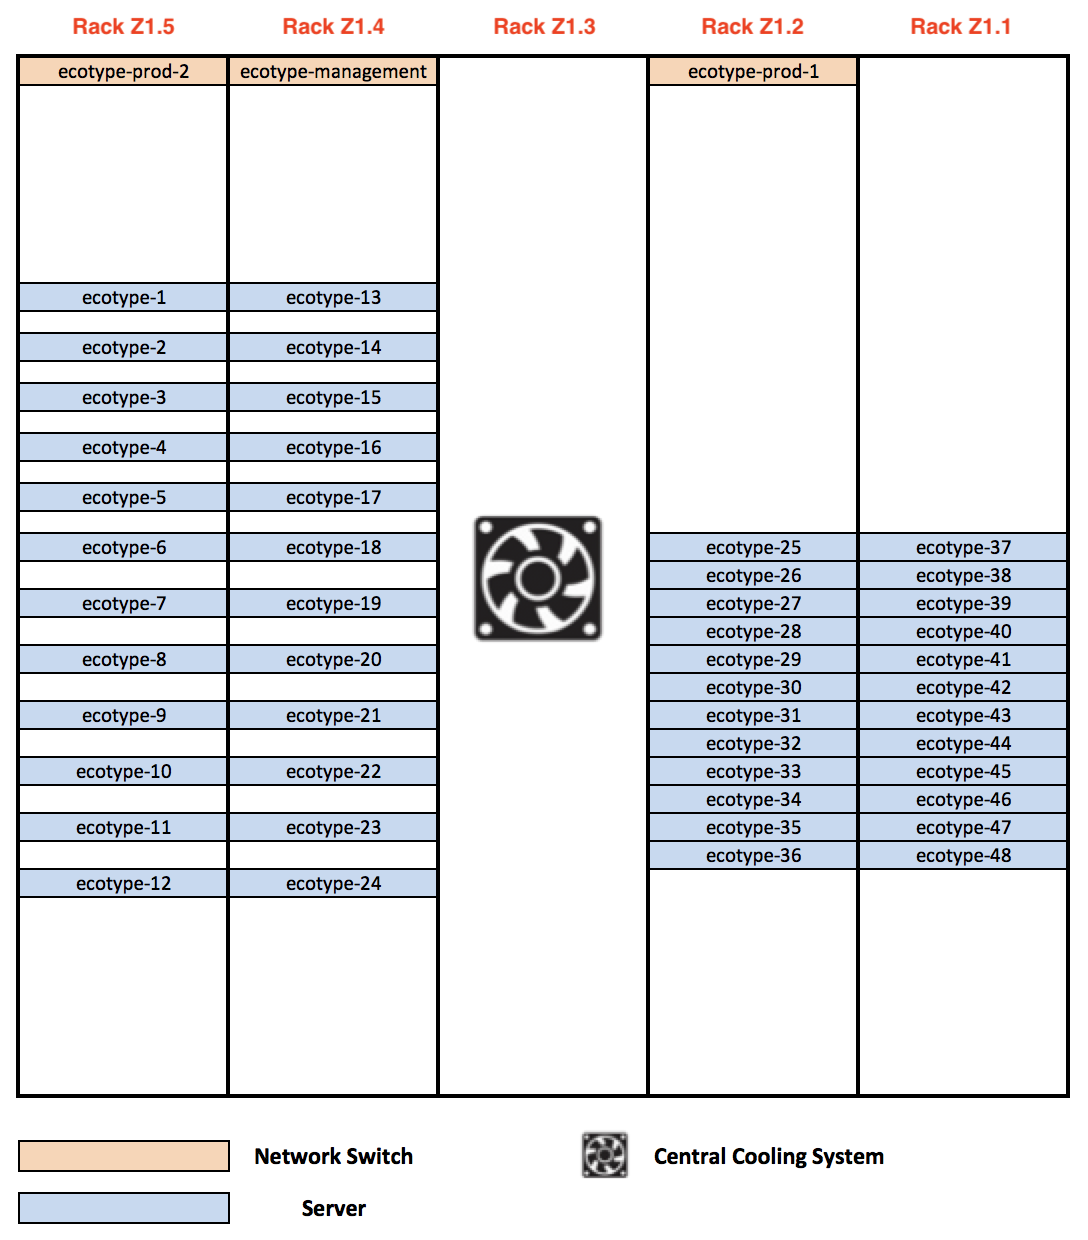 Figure1: Layout of the ecotype cluster (front view)
As shown on Figure 1, one rack (Z3) is used for the cooling the cluster by hosting a dedicated Central Cooling System (CCS), while remaining racks are computing racks and are dedicated to hosting servers. The racks are connected and form two alleys: a cold alley at the front of servers and a hot alley at their back.
As depicted by Figure 1, each computing rack hosts 12 servers, and is organized following two layouts of server positions: one layout where servers are organised in a concentrated way with no vertical space between servers (Z1 and Z2), and a second layout where servers are spaced at 1U intervals (Z4 and Z5).
We have deliberately chosen to use these two layouts: they will enable users to study the impact of the server density over the temperature and the power consumption of servers.
In addition to the servers, the cluster also contains three network switches that are in charge of connecting servers to the production network and the management network of the Grid’5000 infrastructure. Three racks (Z2, Z4, Z5) are hosting each one a network switch.
The 5 racks of the cluster are based on Schneider Electric IN-ROW racks. This rack model creates an inside airtight environment for servers, and guarantees that the environment outside the cluster has a limited impact on temperatures inside the racks. The temperature inside the cluster is regulated by the CCS, which is connected to a dedicated management network and implements a service that enables to remote control the cooling and to access its operating data with the Simple Network Management Protocol (SNMP) protocol. The CCS has several temperature sensors located at different parts of the racks, which are in charge of checking that the temperature inside racks is under a specified temperature threshold. It is possible to change the temperature that the CCS have to maintain inside the racks (Cooling Temperature Target parameter), and also change the temperature of the air injected by the CCS in the cold aisle (Air supply Temperature Target parameter). This will, in addition to the fact that servers have been designed to work in hot environments, enable users perform their experiments at several levels of temperature.
Regarding the temperature outside the cluster, it is regulated by the SCS which is mounted from the ceiling of the server room: the SCS is in charge of maintaining a constant temperature in the server room, and thus it prevents any event outside the racks to disturb the experiments that are conducted on the SeDuCe testbed.
Finally, we have installed several “Airflow management panels” between each pair of servers: they improve the cooling efficiency by preventing the mixing of cold air and hot air inside the racks.
Energy monitoring
The power consumption of each element composing the cluster (servers, network switches, cooling fans, condensators, etc.) is monitored and stored in a database, at a frequency of one hertz (one record per second).
Electrical plugs of servers and network switches are connected to Power Distribution Units (PDUs), which are in charge of ensuring that servers and network switches can meet their power needs. Each computing racks contains two PDUs, and each server of a computing rack has two electrical plugs. As depicted in Figure 4, the two electrical plugs of a server are connected to two different PDUs, which enables servers to implement electrical redundancy. In turn, the PDUs share power consumption of servers and network switches via a dedicated service network: the power consumption of each power plug can be fetched by issuing an SNMP request to the PDU to which it is connected. In turn, the PDU provides the power consumption of each of its outlets.
The energy consumption of the CCS can similarly be fetched via SNMP requests: the CCS implements a SNMP service which is able to provide the overall power consumption and the power consumption of each of its internal part such as the condensator or the fans. On the other hand, the SCS does not implement any built-in networking access, and thus cannot share its metrics with any component over a network. To solve this problem, we instrumented several parts of the SCS by using a Fluksometer: a Fluksometer is a connected device that can monitor several electrical metrics (power consumption, voltage, amperage, etc.) and expose their values over a network via a web-service at a frequency of one hertz.
Finally, we have added an additional system that tracks overall power consumption of servers, switches and the CCS. This additional system is based on the Socomec G50 metering board, and enables to check the soundness of the aforementioned source of power consumption. These additional metrics are fetched by using the modbus protocol.
Thermal monitoring
To track the thermal behavior of the ecotype cluster, each server is monitored by a pair of temperature sensors: one sensor is positioned at the front of the server (in the cold aisle) and another sensor is positioned at the back of the server (in the hot aisle).
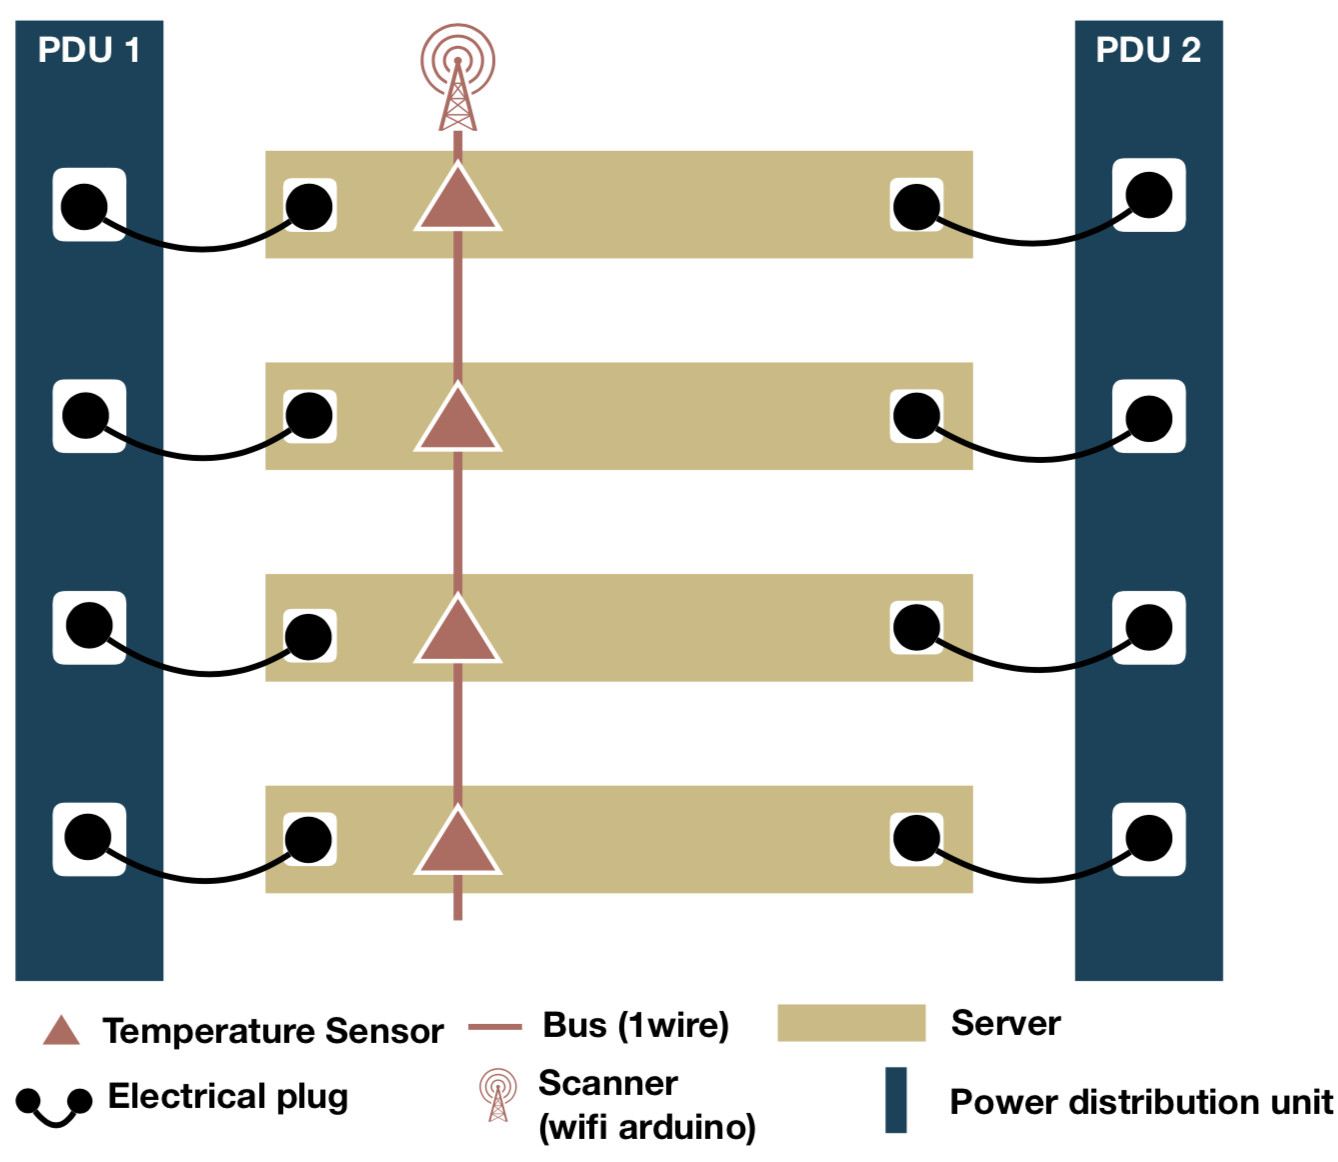 Figure2: Back view of a server rack
As depicted by Figure 2, each temperature sensor is part of a bus (based on the 1wire protocol) connected to a Scanner (based on an Arduino that implements wifi communication) in charge of gathering data produced by temperature sensors of the bus. As the front and the back of each server is monitored by temperature sensors, each computing rack has in total two Scanners and two buses: a front bus for monitoring the cold aisle and a back bus dedicated to the hot aisle. Scanners fetch temperatures from their sensors at a frequency of one reading per sensor every second.
Temperature is collected by using thermocouple sensors : as illustrated by Figure 3, we have designed an electronic card that contains 16 MAX31850K chips produced by “Maxim Integrated” . According to the specifications provided by the constructor, the MAX31850K is able read temperatures between -270°C and 1372°C, with a precision of 0.25 °C between -100°C and 100°C.
The choice of the MAX31850K has been motivated by the fact that the MAX31850K chips implements the 1wire protocol and can be part of an 1wire bus. The electronical card, designed in collaboration of the DSEE (Département systèmes énergétiques et environnement), contains 16 MAX31850K chips connected together to form an 1wire bus, and a Scanner, based on an nodeMCU arduino with built-in wifi capabilities, fetches periodically their temperature readings. The current version of the firmware used by Scanners scans an 1wire bus every second, and then pushes temperature data to a Temperature Registerer service, as illustrated in Figure 4.
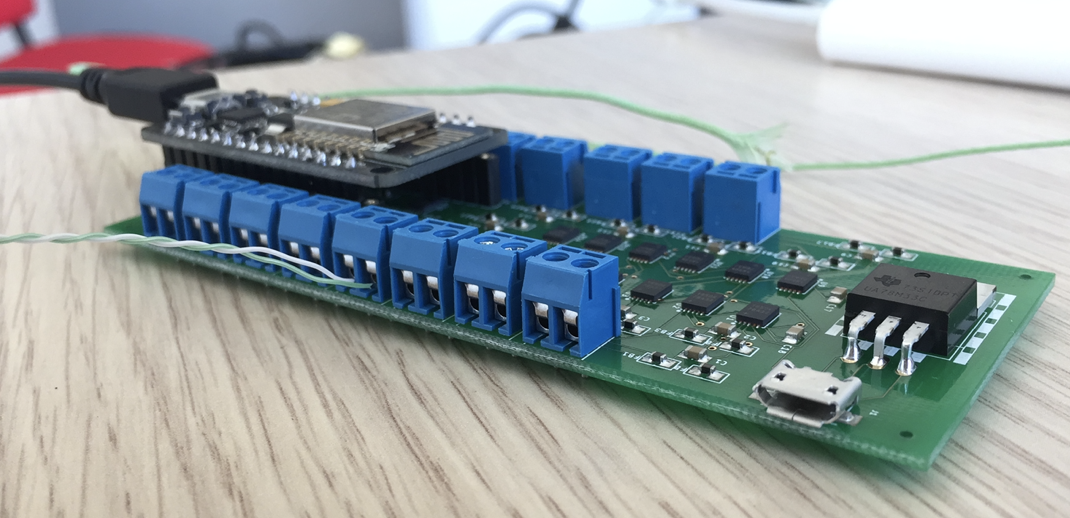 Figure3: Electronical board that contains 16 thermocouples
We also developed a contextualisation tool to generate firmwares for the Scanners. It leverages the PlatformIO framework to program a Scanner that pushes data to a web-service. Using this contextualisation tool is simple: a developer needs to define a program template in a language close to C language and marks some parts of code with special tags to indicate that these parts need to be contextualized with additional information, such as initializing a variable with the ID of a Scanner device or with the address of a remote web-service (such as the one that will receive temperature records). The contextualisation tool takes this program and a context as input parameters, analyses the template program, and completes parts that requires contextualisation with information provided in the context, which results in valid C language source file. Then, the firmware is compiled and automatically uploaded to Scanners via their serial ports. By leveraging this contextualisation tool, we can remotely configure Scanners and update their firmware ``on the fly’’.
Dashboard and API
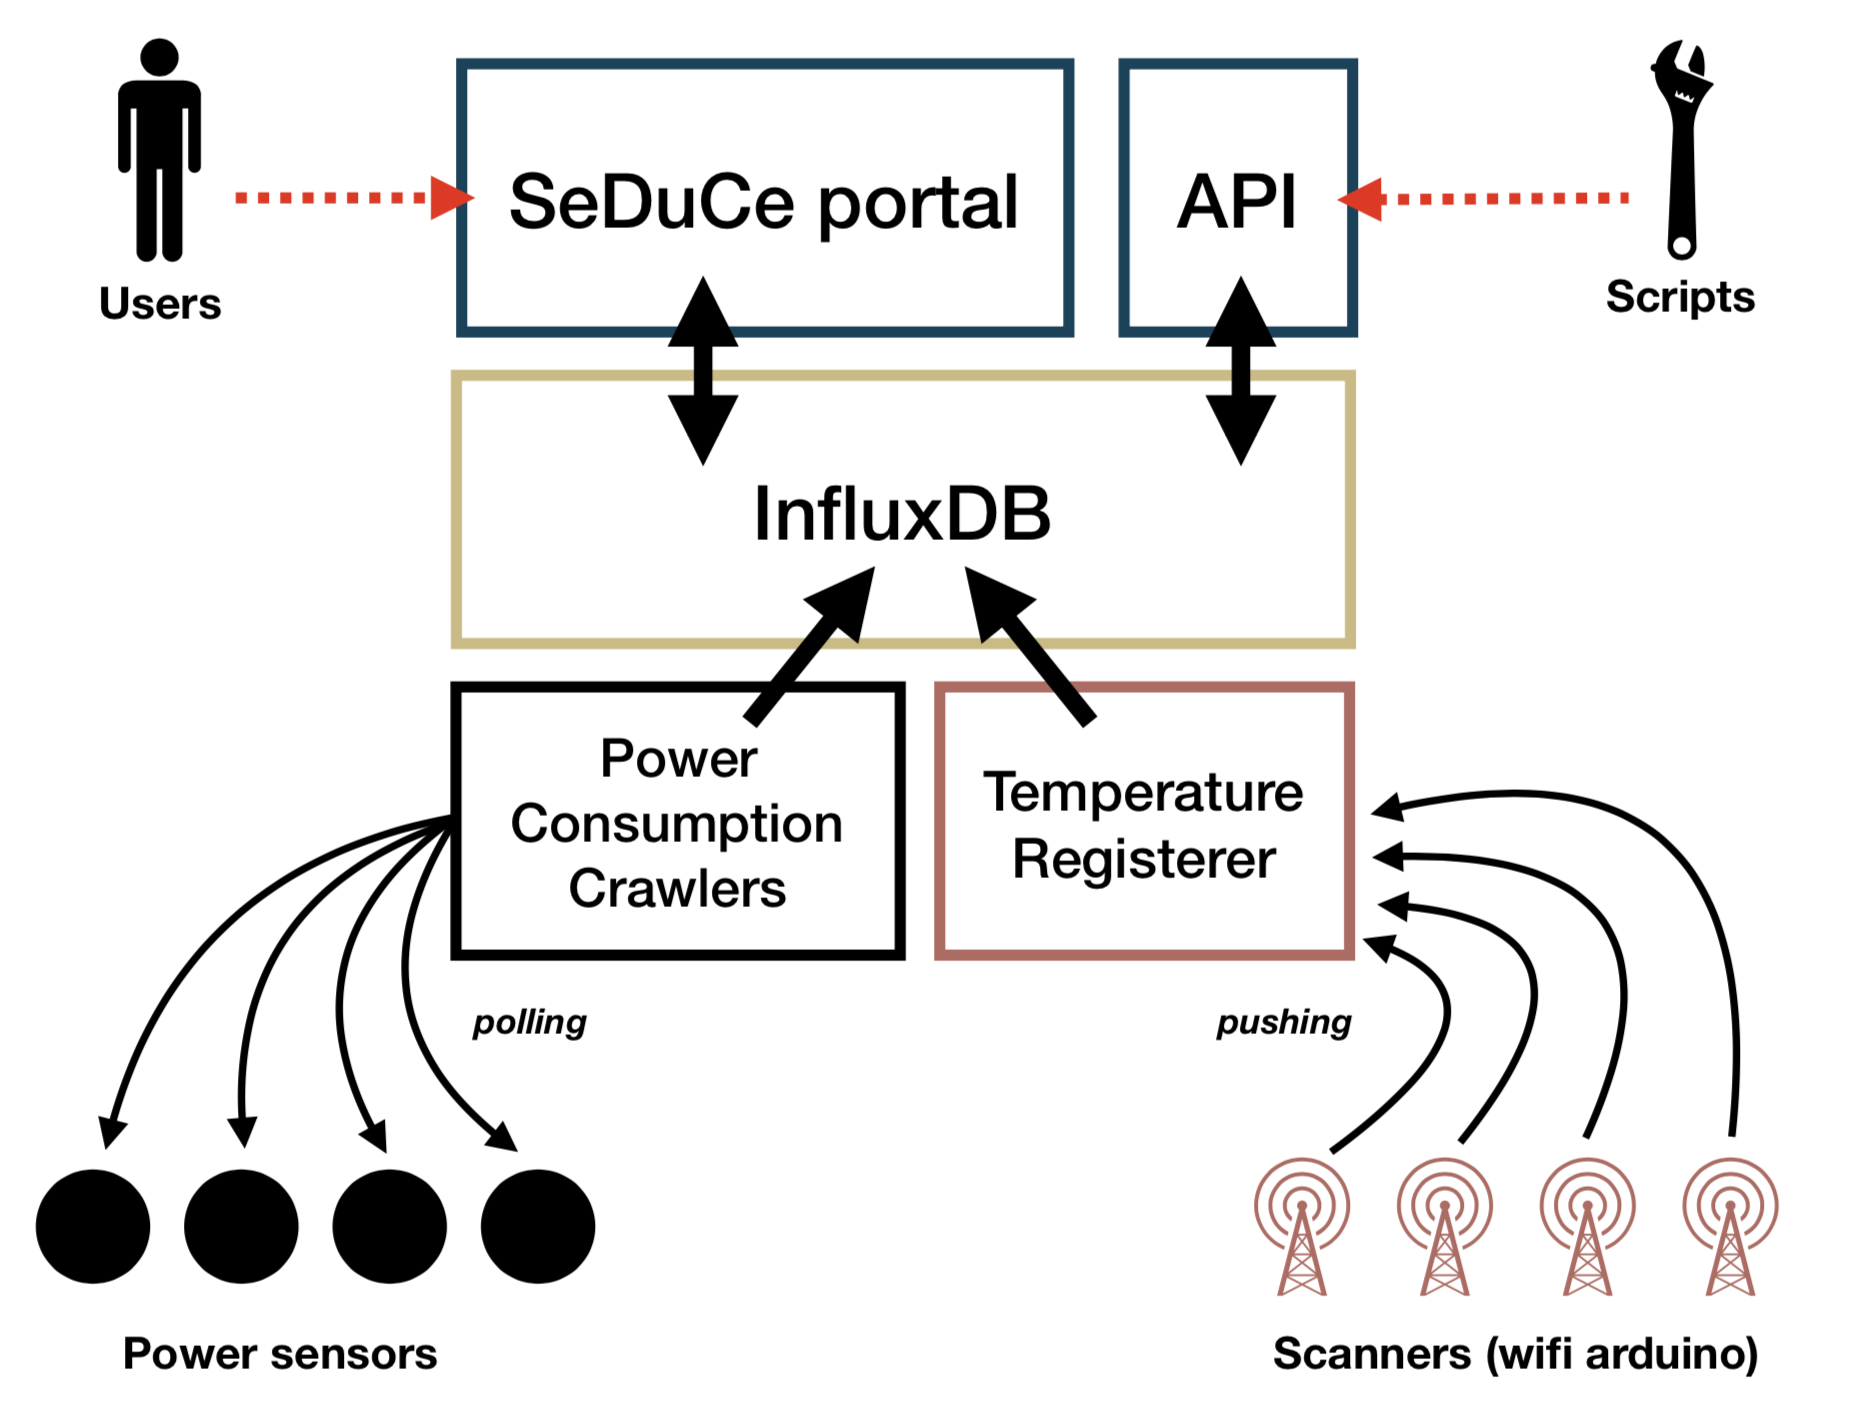 Figure4: Architecture of the SeDuCe portal
To help users to easily access power and thermal metrics generated by the SeDuCe testbed, we developed a platform that exposes publicly two components: a web portal and an API associated to a documentation.
As illustrated by Figure 4, the web portal and the API fetch data from a Time Series Database (TSDB) based on InfluxDB. InfluxDB enables to store a large quantity of immutable time series data in a scalable way. In the background, InfluxDB creates aggregates of data by grouping periodically data from a same series. These aggregated sets of data enable the web portal to promptly load data used for visualization.
- Two kind of components are in charge of inserting data in the database
- the Power consumption crawlers and the Temperature Registerer. Power consumption crawlers are programs that are in charge of polling data from PDUs, Socomecs, Flukso, the CCS and the SCS. In turn, this data is inserted in the database. On the other hand, the Temperature Registerer is a web service that receives temperature data pushed from nodeMCU arduino devices, and inserts it in the database.
The web portal and the API are both written in Python and leverage the Flask micro web framework. The API component makes an extensive use of the Swagger framework which automatises the generation of complete REST web services and their documentations from a single description file (written in JSON or YAML). This choice has enabled us to focus on the definition and the implementation of the API, by reducing the quantity of required boilerplate code.
All the components depicted in Figure 4 are implemented as micro-services. Our system is able to register 200 metrics per seconds with minimal hardware requirements (it is currently hosted on a single computer). In the case we add more sensors to our testbed, it is likely that the existing components would be sufficient. In the case that one of the component would not be able to cope with the additional workload, it would be easy to setup an high availability approach by using a load balancer such as NGINX that would forward requests to a pool of instances of the component.
Toward the integration of renewable energies in the testbed
Coming Soon